About this Visualization
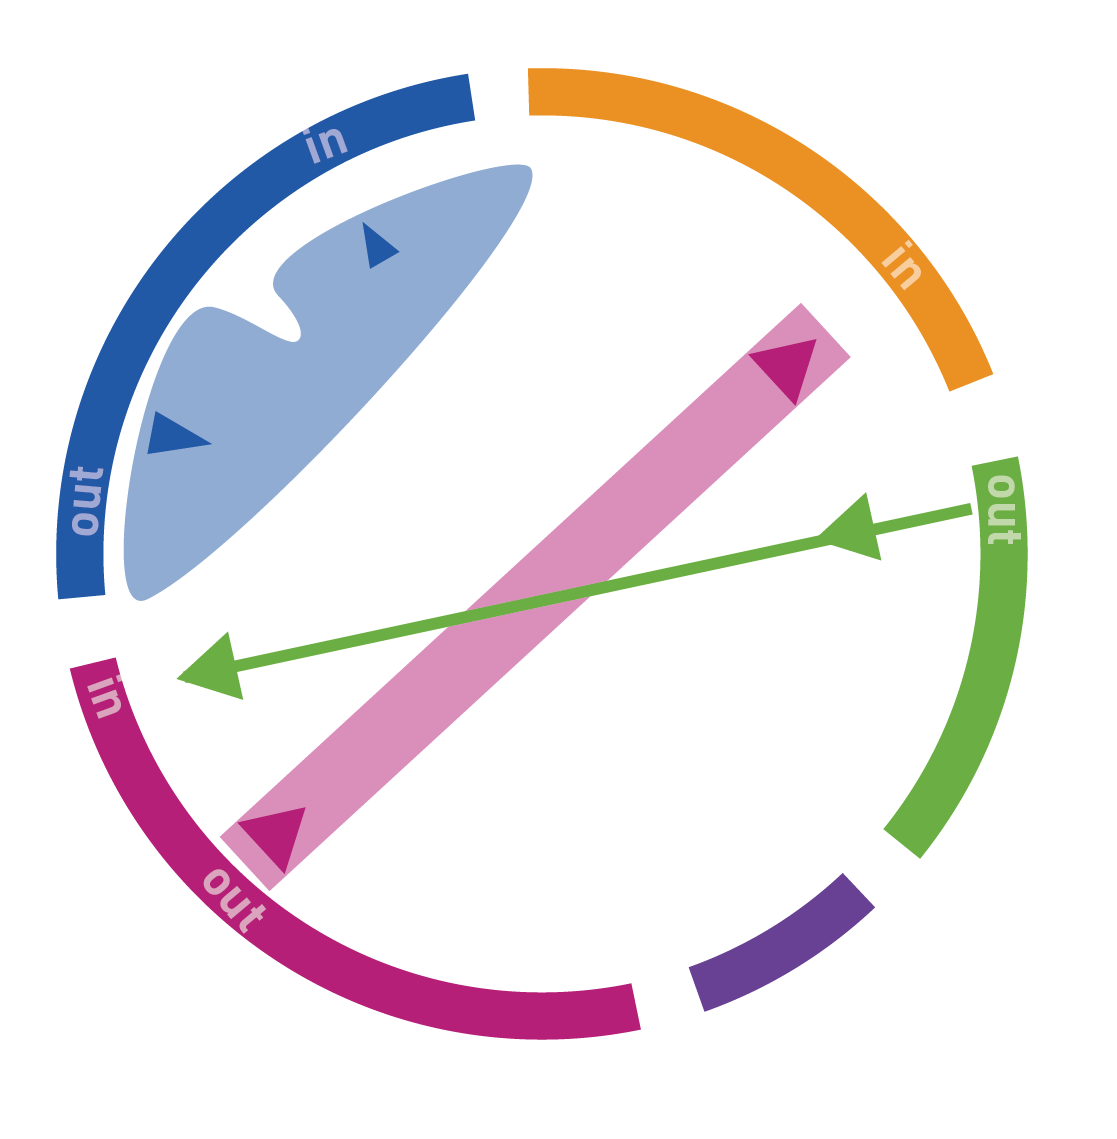
The circular plot illustrates the number of temple relocations between the five regions of Singapore, which are further subcategorised into 55 planning areas. Hovering over an arc of a region or planning area also denotes the number of temples relocating into and away from it. The thickness of each curve is directly proportional to the number of temple flows traveling along that origin-destination trajectory; hovering over each curve shows the number of temples that moved along that specified trajectory. The plot was created based on Sander et al. (2014).
How to Read the Plot
Origins and destinations are represented by the circle’s segments. Each region/planning area is assigned a colour. Flows have the same colour as their origin and the width indicates their size. The direction of the flow is also shown by the gap between flow and region/planning area: small gap indicates origin; large gap indicates destination. Click on a segment to switch between region and planning area view.
About the Data
The bilateral flows between Chinese Temples in Singapore since the 1880s are obtained via qualitative interviews and fieldwork with temple owners in Singapore. The flows can be compared between the five regions and 55 planning areas in Singapore (as delineated by the Urban Redevelopment Authority of Singapore (URA)) and illustrates the number of temples who relocated in temporal steps of 10 years[1]. As with historical data quality issues, it is often difficult to pinpoint the precise location of temples especially for temples whom relocated before the planning boundaries were drawn up by URA. Historical temple addresses are geocoded with the aid of historical maps that denote milestone roads in Singapore[2]. Data is continuously updated and maintained by the Department of Chinese Studies, National University of Singapore.
Footnotes
[1]: Urban Redevelopment Authority. “View Planning Boundaries”. https://www.ura.gov.sg/uol/master-plan/Contacts/View-Planning-Boundaries, last accessed 3 Jan 2018. [2]: National Archives of Singapore. (2016). “SINGAPORE, MILEAGES ALONG ROADS, 1936 | Archivist Pick of the Week”. http://www.nas.gov.sg/blogs/ archivistpick/mileages/, last accessed 3 Jan 2018.
Credits
A collaboration between:


Inspired by Martin Krzywinski's Circos and Mike Bostock’s D3.js library
Contact
About the Project:
Email to Prof. Kenneth DEAN; Dr. HUE Guan Thye; Prof. FENG Chen-Chieh; Prof. WANG Yi-Chen
About the Circular Plots:
Email to Dr. YAN Yingwei; Mr. CHIAM Da Jian
About the Data:
Email to Dr. HUE Guan Thye